
Who leads the La Liga all-time table?
Real Madrid lead the historical La Liga table. At the end of the 2024/25 season, they had accumulated 5,043 points under the scoring rules used in each era, ahead of Barcelona on 4,937. That is a record of league achievement across generations, rather than a ranking of which side would win a match today.
The top ten below use one fixed historical checkpoint: the end of 2024/25, covering 94 completed league editions. They do not include 2025/26 or matches from 2026/27. Keeping a complete season as the reference makes the comparison reproducible and avoids mixing a club's updated total with a rival's older one. For this season's title race and relegation positions, use the current La Liga table.
| Rank | Club | Seasons | Matches | Wins | Points |
|---|---|---|---|---|---|
| 1 | Real Madrid | 94 | 3,066 | 1,846 | 5,043 |
| 2 | Barcelona | 94 | 3,066 | 1,787 | 4,937 |
| 3 | Atlético Madrid | 88 | 2,918 | 1,420 | 4,053 |
| 4 | Athletic Club | 94 | 3,066 | 1,322 | 3,805 |
| 5 | Valencia | 90 | 2,968 | 1,294 | 3,801 |
| 6 | Sevilla | 81 | 2,712 | 1,118 | 3,284 |
| 7 | Espanyol | 88 | 2,854 | 1,008 | 3,040 |
| 8 | Real Sociedad | 78 | 2,606 | 991 | 3,029 |
| 9 | Real Betis | 59 | 2,032 | 731 | 2,339 |
| 10 | Celta Vigo | 59 | 2,002 | 679 | 2,154 |
Source: RSSSF's 1929–2025 historical classification. The BDFutbol historical club records offer a separate, updating reference; their later totals should be read with their own date.
The interesting comparison is not confined to first place. Athletic finished this checkpoint only four historical points ahead of Valencia. That small gap describes the accumulation of decades of results. It does not imply that those clubs had similar squads, finances or prospects in the next match. A single season can alter a close historical contest while leaving the much larger gaps between other clubs almost untouched.
Read across each row before comparing the last column. Seasons explain how often a club had the opportunity to compete, matches measure the actual number of fixtures, and wins tell you how many of those opportunities produced victory. A strong historical position can combine longevity with outstanding football, but those ingredients appear in different proportions for different clubs. The table becomes much more revealing when those differences remain visible.
Why historical points differ from three-point totals
Two apparently reliable historical tables can display different point totals without disagreeing about a single result. The crucial question is whether they preserve the points awarded at the time or recalculate every victory at today's value. The heading “all-time table” does not, on its own, resolve that question.
The original points system preserves what teams actually earned
La Liga awarded two points for a win before switching to three in 1995/96. Draws were worth one point. LaLiga explains that change in its comparison of close title races, while Athletic Club also distinguishes the two systems in its historical-table coverage. The points column in our top ten preserves those changing values.
Real Madrid's 1994/95 championship supplies a clear example. Their record was 23 wins, nine draws and six defeats from 38 matches, according to the BDFutbol season table. The awarded total was 55: twice 23, plus nine. Looking at that number beside a modern championship total without acknowledging the rules would make an excellent campaign appear much weaker than it was.
This original-points approach answers a historical question: how many league points did the club actually accumulate? It keeps the reward structure that applied to each result. Its limitation is equally clear. A victory in the early decades adds less to the total than a victory after the rule changed, so the last column does not value every win equally.
Normalizing every win changes the comparison
A normalized table applies three times wins, plus draws throughout the archive. Madrid's same 1994/95 results then become 78 points: three times 23, plus nine. The additional 23 are a mathematical adjustment, one for each victory; they were never awarded in that season. Both totals can be useful when they are accurately labeled.
Normalization creates a common arithmetic scale, but it does not recreate a different football season. Teams played with the incentives, opposition and circumstances of their own period. Revaluing a draw and win record cannot tell us whether a manager would have chased a late winner, protected a lead differently or selected another side under different rules. That is a hypothetical question, separate from the calculation.
For a fair comparison, choose one convention and keep it for every club. Do not compare one team's original historical points with another's normalized total. If you want to understand the football underneath the arithmetic, start with wins, draws and defeats; the La Liga results page shows how individual matches create those categories in the present competition.
What wins, goals and titles reveal about the leading clubs
Accumulated points, total victories, goals and championships measure different achievements. A win contributes to the historical total regardless of whether it arrives in a title-winning campaign or a disappointing season. A championship records the outcome of one complete race. A goal might settle a tight game or merely extend an already comfortable lead.
That distinction matters when supporters use the historical table to argue about greatness. Winning consistently across decades and producing the most dominant single campaign are separate accomplishments. A club could have a brilliant peak and then spend years outside the division; another could finish respectably every season without matching that peak. A useful argument identifies which achievement is being compared before choosing its statistic.
Real Madrid and Barcelona lead in different columns
At our 2024/25 checkpoint, Madrid were ahead on accumulated points and victories, while Barcelona had scored more league goals. Those statements can coexist because scoring volume and winning frequency are not identical. A three-goal victory and a one-goal victory produce the same points under the same rules. A high-scoring draw may add more goals than a narrow win while contributing fewer points.
Individual seasons show the same principle on a smaller scale. Madrid's 2011/12 side finished with 100 points and 121 goals. Barcelona's 2012/13 side also collected 100 points, scoring 115. Each won 32 league matches. Their point totals matched even though their attacking totals did not.
For a football comparison, the next question should concern how those points were earned: where the dropped points occurred, how regularly the side won away, and whether matches stayed competitive until the final stages. Those details make a season memorable, but they cannot all be recovered from the final total. The aggregate is the starting point for that discussion, rather than a substitute for watching or revisiting the matches.
Player records belong alongside this analysis, with their own scope. Our La Liga all-time top scorers guide follows individual league goals. It helps explain an attacking legacy, while the club table includes the contribution of defenders, goalkeepers, coaches and many generations of players whose work translated into results. Neither record needs to do the other's job to be valuable.
Why Athletic Club and long-serving clubs matter
The historical classification gives a fuller picture of Spanish football than a list containing only the most recent champions. It preserves the contribution of clubs whose standing comes from many decades of top-flight participation. Staying in the division is part of the sporting story, particularly when a club has survived poor seasons as well as celebrated great ones.
Ever-present clubs have more chances to accumulate points
LaLiga identifies Athletic Club, Barcelona and Real Madrid as the three clubs never relegated from the competition. They have been present since its first edition. That explains the matching season counts in our historical checkpoint, even though their points and wins differ substantially.
Opportunity does not guarantee achievement: the same fixture can end in a win, draw or defeat. Yet uninterrupted membership gives a club the chance to keep adding to its top-flight record every season. Athletic's place near the top therefore records both results and continuity. Its longevity deserves recognition in its own right, without requiring a claim that every Athletic side was stronger than every team below it.
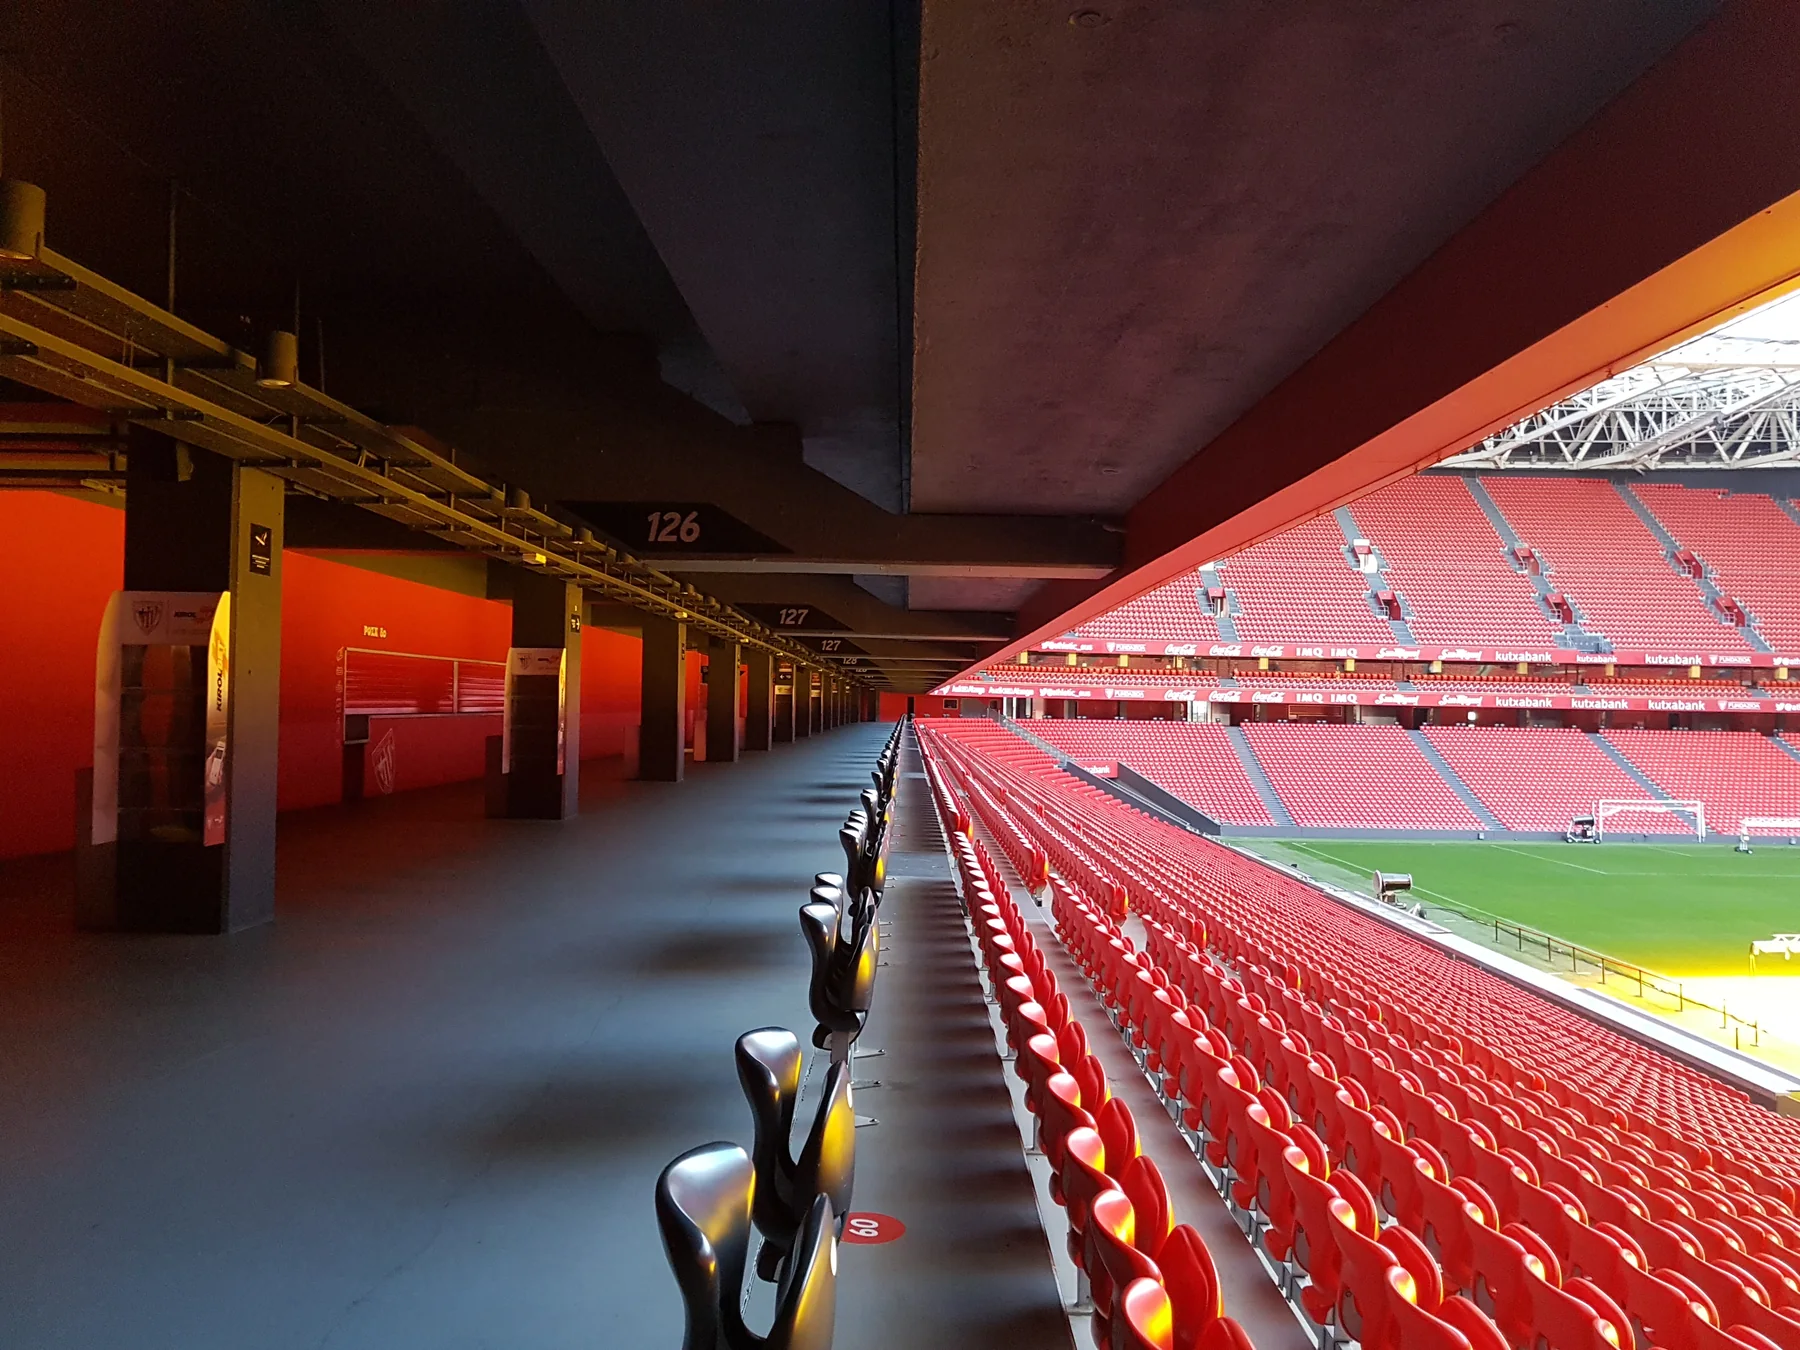
Relegation pauses a club's top-flight total
A season in the second division can be hugely important to a club and its supporters, but its points do not enter this first-division classification. Promotion resumes the accumulation; it does not convert the previous season's lower-tier points into La Liga points. This is why club age and the number of top-flight seasons should never be treated as interchangeable.
That also explains why a famous name can retain a high historical position during an absence from the top flight. Its past results remain part of the record, while active rivals can continue adding points. To explore the continuity question further, read which La Liga teams have never been relegated; to see the present competition's participants, use the teams directory.
Recent success can outpace a club's historical rank
Villarreal illustrate the importance of when a club first reached this level. Their official league record traces their first promotion to 1998 and a runner-up finish in 2007/08. They began collecting top-flight points decades after the founding members, yet were capable of finishing above many clubs with far longer records.
When assessing such a team, compare its total with its number of matches and consider a defined recent period as well. A shorter history can coexist with a sustained run of strong modern finishes. This gives supporters two useful stories to follow: the club's current ambitions and its gradual movement through the longer historical record. Neither cancels the other.
How league formats change comparisons across eras
Points are not the only part of the calculation that changed. The number of opponents and the structure of a campaign also affect how many matches a club can add to its record. In a 20-team double round-robin, each side faces 19 opponents twice, producing 38 matches. That familiar calendar should not be imposed on every historical season.
The 1996/97 competition had 22 clubs and 42 matches per team, as the season's final table shows. The unusual 1986/87 campaign included a final group stage after the initial league programme. Madrid's account of that title records 44 matches. One season in the archive therefore does not always represent the same number of chances to score, win or collect points.
This is why total matches belong beside seasons in a historical table. Dividing a club's points by its seasons may seem convenient, but the resulting average mixes campaigns of different lengths. Dividing by matches addresses that particular problem. It still leaves the two-point versus three-point distinction unless the points have first been placed on a common scale.
For an efficiency comparison, normalized points per match can be calculated as (three times wins, plus draws) divided by matches played. Victory percentage is another useful lens: wins divided by matches, multiplied by 100. Neither calculation should be introduced without explaining it. A hypothetical side winning 30 of 60 games has a 50 percent win rate; one winning 300 of 1,000 has 30 percent. The former has the higher rate, while the latter has delivered ten times as many victories.
Sample size matters because a short successful spell and many decades in the division are different tests. Rates can make a late arrival look impressive; totals reveal the sustained contribution of a long-serving club. Using both avoids treating longevity as a flaw or a short history as proof of superiority. For season-length details, our guide to how many games a La Liga season contains explains the calendar behind the usual match counts.
Even after those adjustments, the comparison remains historical rather than a controlled experiment. Opponents, playing conditions and the wider competition changed. Arithmetic can correct the scale of points and the number of fixtures; it cannot turn teams from different decades into participants in the same season. The most useful reading keeps that limit visible while enjoying what each record tells us.
How to use the historical table when following La Liga today
The historical table adds perspective to a match without deciding its outcome. It can explain why an encounter carries weight for supporters or why a club celebrates a cumulative milestone. The immediate sporting question still belongs to the current season: what the result means for the title race, European places or survival.
Compare the right records before judging a team
Start with the current standings, then look at recent results and the opponent. The official LaLiga season table follows the same essential categories of played, won, drawn, lost and points, but its race starts again each campaign. Historical status does not supply a head start in August, nor does it protect a club from a difficult run.
For a forthcoming game, home and away context, the available players, rest and recent performances are more immediate questions than a century of accumulated points. The historical table can explain a reputation; it cannot establish the likely lineup or the physical condition of the current squad. Treat those as separate pieces of a match preview and seek current confirmation before drawing conclusions.
There is still a simple connection between present and past. A modern league victory contributes three points to that season and to an original-points historical total; a draw contributes one. If two active clubs are close in the cumulative ranking, their results against every opponent matter to that contest. A meeting between them is especially evocative, but it is not the only way the historical gap moves.
Read the date and competition before sharing a number
Before repeating an all-time figure, check its last included season or match, its win-value convention and its competition coverage. A table covering a provider's available match history may use “all time” for that collection without spanning the league's entire existence. A surprisingly small matches column is a reason to inspect the coverage rather than immediately declare the record wrong.
The same care applies to rivalries. LaLiga's Clásico statistics separate league matches from all-competition meetings. A Champions League win or a cup goal belongs in those competitions' records, not in a La Liga club total. Friendly matches are another distinct category. A number becomes meaningful when its boundaries are clear.
Use this article's 2024/25 checkpoint as a historical reference, the today's matches page to find the current action, and completed league results to follow what changed. That combination lets you appreciate the weight of a club's history while understanding what its latest result actually achieved.
Comments
Sign in with Google to comment. Keep the conversation useful and football-focused. New comments are reviewed before they appear.
Loading comments…